Wx Info: Reading a Skew-T
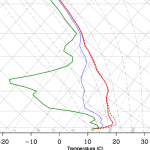
Reading a Skew-T chart is really easy once you get accustomed to the layout. It is just like reading a line graph, only part of the chart is at an angle. Really, you only need to worry about two lines. The red line is the temperature line, the green line is the dewpoint. When they are really close together like… Read more →


